Part 6: Processing Collected Data
In this part of the tutorial, you will:
Read and parse the data collected from a mission.
Read the map recorded for the mission.
Interpret position data to map recorded images to a final report.
Understanding the data
We will be using two sources of data for our processing script: the map and the downloaded data from a mission playback.
The map data is made up of a collection of waypoints, and the edges that connect them. The downloaded data will contain the images we recorded, and a json file that includes all other data and metadata stored during the mission.
For displaying the data, we are going to use the anchoring defined in them map. This will define a global “seed” frame, and all of the waypoint and data locations will be provided in that “seed” frame. For the map, there is an Anchoring message defined in the map, which will have a list of anchors that provide the seed_tform_waypoint transforms. For the downloaded data, we will use the basic-position-data metadata, which stores a seed_tform_body transform for each capture action.
Writing the processing script
Copy (or download) the script below into a file called process_data.py in the ~/data_capture folder.
Initial imports. We will use matplotlib to draw the data.
import json
import matplotlib.pyplot as plot
import numpy as np
from PIL import Image

from bosdyn.api.graph_nav import map_pb2
To extract the data we need, we will parse the metadata.json file that we downloaded along with the images. This is simply a large json file, so we load it using python’s built-in json support.
def extract_data(filename):
    """Display the captured images and battery data (and optionally the map edges)
    onto a plot of the "seed" frame."""
    with open(filename, 'r') as f:
        json_data = json.load(f)
Next we will iterate through all of the “actions” stored in this data, and extract the individual pieces we need.
    out_data = []
    for action in json_data['actions']:
Note that we only want to extract data for the web cam images we took. If any other data collections took place in this mission, we
will skip over them. For this test we will check if the action stored anything to the “web-cam-service_video0” channel. If you did not use the web cam example in your data collection, you can instead check for the “battery” channel in the metadata: if 'battery' not in action['metadata']:. Images and binary data will be in the json under the “data” key, while pieces of data stored as AssociatedMetadata to the action will be under the “metadata” key.
        if 'data' not in action or 'web-cam-service_video0' not in action['data']:
            # Only process actions that saved to the web-cam-service_video0 channel
            continue
We will extract out the particular pieces of data we want to display. From the image capture we will extract the action name and the image file name. We assume only one image was stored on this channel.
        image_action = action['data']['web-cam-service_video0'][0]
        action_name = image_action['data_id']['action_id']['action_name']
        image_file = image_action['filename']
From the metadata, we read from the “basic-position-data” channel to get the location in the “seed” frame. We also read the battery data that our example plugin saved to the “battery” channel. The full set of data is appended to our list of action data and returned.
        odom_location = action['metadata']['basic-position-data'][0]['data']['seed_tform_body'][
            'position']
        battery = action['metadata']['battery'][0]['data']['battery_percentage']
        out_data.append((odom_location['x'], odom_location['y'], action_name, battery, image_file))
    return out_data
We are now going to plot this extracted data along with the map. We provide an additional argument to tweak how large the images will appear.
def plot_data(action_data, graph: map_pb2.Graph = None, image_size=2):
    """Display the captured images and battery data (and optionally the map edges)
    onto a plot of the "seed" frame."""
    plot.axis('equal')  # Keep the x and y axes at the same scale.
For the map, we will plot each edge as a line, using the seed positions of the “from” and “to” waypoints for each edge. anchor_positions() is a helper to read this data from the map, defined later.
    if graph:
        # Plot all edges in the map
        wp_seed = anchor_positions(graph.anchoring.anchors)
        for edge in graph.edges:
            from_wp = wp_seed[edge.id.from_waypoint]
            to_wp = wp_seed[edge.id.to_waypoint]
            plot.plot([from_wp[0], to_wp[0]], [from_wp[1], to_wp[1]])
Next we want to plot the data for each capture action. First, we’ll load the image and figure out the aspect ratio and x and y sizing to use.
    # Plot the image, battery level and label for each action.
    for x, y, action_name, battery_percent, filename in action_data:
        image = Image.open(args.data_dir + '/' + filename)
        aspect = image.size[1] / image.size[0]  # keep the aspect ratio the same for the image.
        sx, sy = image_size, image_size * aspect
Now we plot three things:
The image, centered on the waypoint.
The action name, beneath the image.
A battery gauge, to the right of the image.
        plot.imshow(np.asarray(image), origin='upper', extent=(x - sx, x + sx, y - sy, y + sy),
                    zorder=2)
        # Plot the action name under the image.
        plot.text(x, y - sy, action_name, ha='center', va='top', zorder=3)
        # Draw a battery gauge to the right of the image.
        draw_battery((x + sx, y), scale=sy, fraction=battery_percent / 100)
    plot.show()
Below are the helper functions used in the drawing code above. First, the helper to get the x and y position for each waypoint.
def anchor_positions(anchors):
    """Returns a dict of waypoint ids to seed positions for the given anchors."""
    return {
        a.id: (a.seed_tform_waypoint.position.x, a.seed_tform_waypoint.position.y) for a in anchors
    }
Next, a drawing helper that draws a basic battery gauge.
BOX = np.array([[0, -1], [0, 1], [0.6, 1], [0.6, -1]])


def draw_battery(origin, scale, fraction):
    """Draw a simple battery gauge."""
    box_x, box_y = BOX[:, 0] * scale, (BOX[:, 1] * fraction - (1 - fraction)) * scale
    plot.fill(box_x + origin[0], box_y + origin[1], 'g', zorder=3)
    box_x, box_y = BOX[:, 0] * scale, BOX[:, 1] * scale
    plot.plot(box_x + origin[0], box_y + origin[1], 'k', zorder=3)
All that remains is loading the correct data and passing it to these functions. The map file will be stored in binary format in a file from the tablet. To use the data, we will parse it into a protobuf.
def load_graph(filename):
    graph = map_pb2.Graph()
    with open(filename, 'rb') as f:
        graph.ParseFromString(f.read())
    return graph
To read the data, we will specify a data directory that contains the unzipped contents of the data downloaded from the robot, and the graph file copied from the tablet. We then pass this to extract_data() and load_graph() and then use that with plot_data().
if __name__ == '__main__':
    import argparse
    parser = argparse.ArgumentParser()
    parser.add_argument('--data-dir', required=True, help='Directory of downloaded data')
    parser.add_argument('--graph', help='Graph file of the recorded map')
    parser.add_argument('--image-size', default=2, type=float,
                        help='Size of the recorded images to display on the map (meters)')
    args = parser.parse_args()

    action_data = extract_data(args.data_dir + '/metadata.json')
    graph = None
    if args.graph:
        graph = load_graph(args.graph)
    plot_data(action_data, graph, image_size=args.image_size)
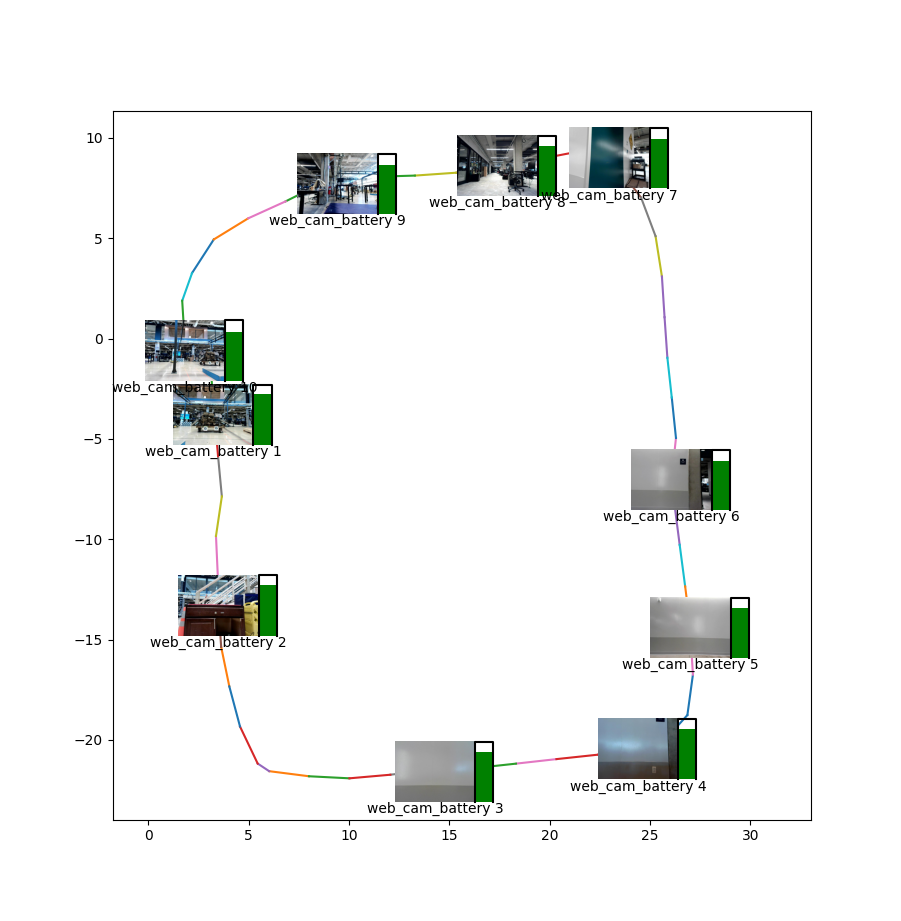
The final result will be the map with the data collection overlaid. Tweak the --image-size parameter to get something that looks good for your map size and collection density.