Basic Streaming Visualizer for API Messages
This example program visualizes Spot’s perception scene in a consistent coordinate frame. It demonstrates:
How to convert API objects, such as local grids and world objects, into the vision world frame.
Create a basic rendering of these objects using python VTK.
Stream the API messages to continuously update the visualization for a live-view.
Setup Dependencies
This example requires the bosdyn API and client to be installed, and must be run using python3. Using pip, these dependencies can be installed using:
python3 -m pip install -r requirements.txt
Running the Example
To run the example:
python3 -m basic_streaming_visualizer ROBOT_IP [--local-grid {no-step,obstacle-distance,terrain}]
As well, the example program takes an optional command line argument of --local-grid to specify which local grid sources to be visualized. The argument must be one of {terrain, obstacle-distance, no-step}. By default, the program will visualize the terrain map, which shows the estimated heights of objects near Spot. To visualize more than one grid source at a time, you must repeat the command line argument for each grid source; for example, --local-grid terrain --local-grid no-step.
Camera Controls
The controls to interact with the visualization screen while the example is running:
R : reset the camera
Left Mouse: rotate the camera
Right Mouse: zoom in/out.
Middle Mouse: pan the camera.
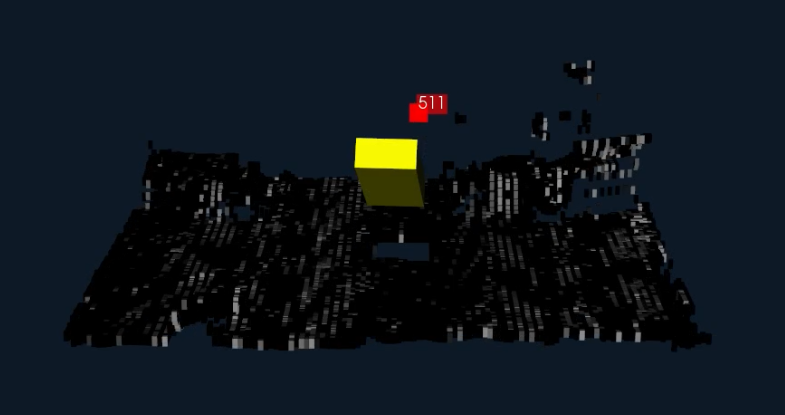
Visualized Objects
The basic visualizer will display different objects in Spot’s perception scene:
Spot is shown as a yellow, rectangular prism with position and orientation matching the robot state.
Fiducials are shown as red squares with the ID in text above the actual fiducial object.
Other world objects are visualized as small blue spheres at the location of the world object.
The local grid maps are visualized with color correlating to the intensity values of the grid, and the voxels correlating to the height of the terrain grid.