GraphNav GPS Viewer
This is an example program for opening, parsing, and viewing a GraphNav map on Open Street Maps in the browser. This example may be used with GraphNav maps generated using Autowalk or the command line interface to GraphNav.
Setup Dependencies
This example requires Numpy, and requires python 3. Using pip, these dependencies can be installed using:
python3 -m pip install -r requirements.txt
Running the Example
Record a map using AutoWalk or the Command Line Interface. (If using Autowalk, transfer the map from Documents/bosdyn/autowalk/your_map.walk to your local machine using a USB cable). The map should be a directory of the form:
- /your_map.walk
    + graph
    - waypoint_snapshots
    - edge_snapshots
Your robot must have a GPS payload attached. To record a map using GPS coordinates, pass in the -g argument to the command line interface. The tablet should automatically record maps that have GPS coordinates.
Run the program.
python3 -m view_gps <path_to_your_map_directory>
Open a web browser and navigate to http://localhost:8080.
You should see an image similar to the one found in the data directory: 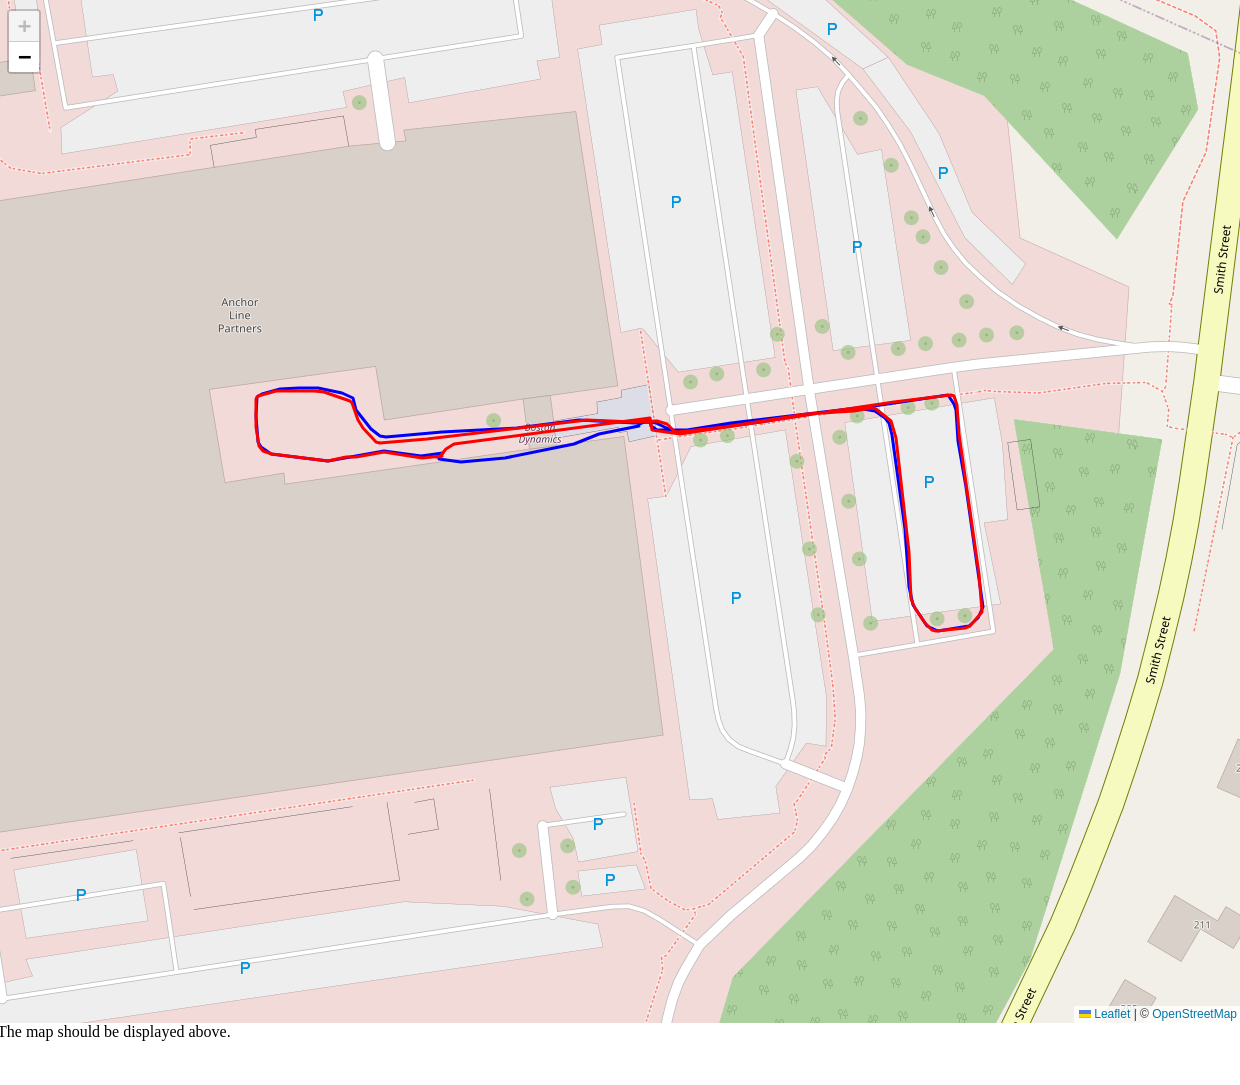
. The blue lines represent the raw GPS data where the robot traveled while recording the map. The red lines represent our best guess of where the waypoints were in the Earth’s reference frame, given the raw data and other details. Note that you must be connected to the internet to see these data.
If you do not see red lines, this means no annotated GPS data exists. To create these annotations, you may run anchoring optimization (see the graph_nav_anchoring_optimization example), or use recording command line service to optimize the map and re-download it.
Understanding the Example
The example begins by loading the waypoints and snapshots from the map.
def load_map(path: str) -> tuple:
It then extracts the raw gps data from waypoint snapshots and the data from waypoint annotations, converting from Earth-Centered-Earth-Fixed to Latitude-Longitude-Height, if necessary.
def get_raw_gps_data(current_waypoint_snapshots: dict) -> list:
def get_annotated_gps_data(current_waypoints: dict) -> list:
From there, it generates a web page that displays these data.
def plot_gps_web_document(raw_gps_data_array: np.array, annotated_gps_data_array: np.array):
The web page uses the leaflet.js library to display data on an Open Street Map web page.